
Today, the word “streaming” is synonymous with companies like Netflix, YouTube, Hulu, and Amazon.
And that’s because we spend a ton of time on these platforms. In a world where more than 57% of all internet traffic [A] consists of video streaming, chances are that you will interact with at least one, if not all three of these services before the day is out.
Video streaming has grown tremendously over the past decade – in audience numbers, in ad revenue, in cultural significance, in content libraries, and in bandwidth.
If the plethora of emerging new video streaming services proves anything, it’s that there is still room to grow, audiences to reach, and money to be made. The “Streaming Wars” have commenced, and there is a lot on the line — especially after the COVID-19 pandemic made streaming content one of the only outlets for entertainment. Smart product strategists at these giants are always looking for the next alpha – where can they adopt what competitors are doing to hook us even more.
Here are 80+ facts, figures, and statistics about the streaming giants whose platforms feed the voracious global appetite for instant, on-demand video content.
Quick Navigation:
- Video Streaming and COVID-19
- YouTube Streaming Statistics
- Netflix Streaming Statistics
- Hulu Streaming Statistics
- Amazon Prime Video Streaming Statistics
Video streaming statistics

How big is online video streaming?
- The global market size for video streaming is projected to reach $184 billion USD by 2027, growing more than 20 percent from 2020. [B]
- By 2022, online videos will make up more than 82 percent of all IP traffic. This is a 15-fold increase over 2017.[C]
Video streaming statistics during COVID-19
- Video streaming accounted for nearly 60% of all internet traffic during stay-at-home orders in the spring of 2020. [A]

- In late March 2020, demand for streaming video content was so high that the EU asked Netflix and YouTube to temporarily reduce the quality of their streaming by 25% in order to prevent the internet from collapsing from unprecedented usage. Both companies agreed to a 30 day reduction in video quality for users in the European Union. [D]
- In Q2 2020, streaming video comprises 1 out of every 4 minutes of television viewed in the United States. [E]
- The record high for total minutes of video streamed in the U.S. was the week of April 6, 2020. Streaming services reported 169.9 billion minutes were streamed during this week, more than double the amount of minutes streamed during the same week in 2019. [E]
- During the first quarter of 2020, the average U.S. adult spent 5 hours and 56 minutes consuming video content every day. [E]
- A May 2020 survey showed that 70 percent of consumers would rather stream newly debuted films from home than watch in a local cinema. Many cited coronavirus fears as part of the reason they’d be reluctant to head to a theater anytime soon. [F]
- Even after the initial surge in video streaming due to the COVID-19 pandemic has leveled off, U.S. consumers continue to stream about 50% more in 2020 than they did in 2019. [E]
- U.S. consumers between the ages of 35 and 54 accounted for the greatest percentage (27%) of weekly streaming minutes in Q2 of 2020. [E]
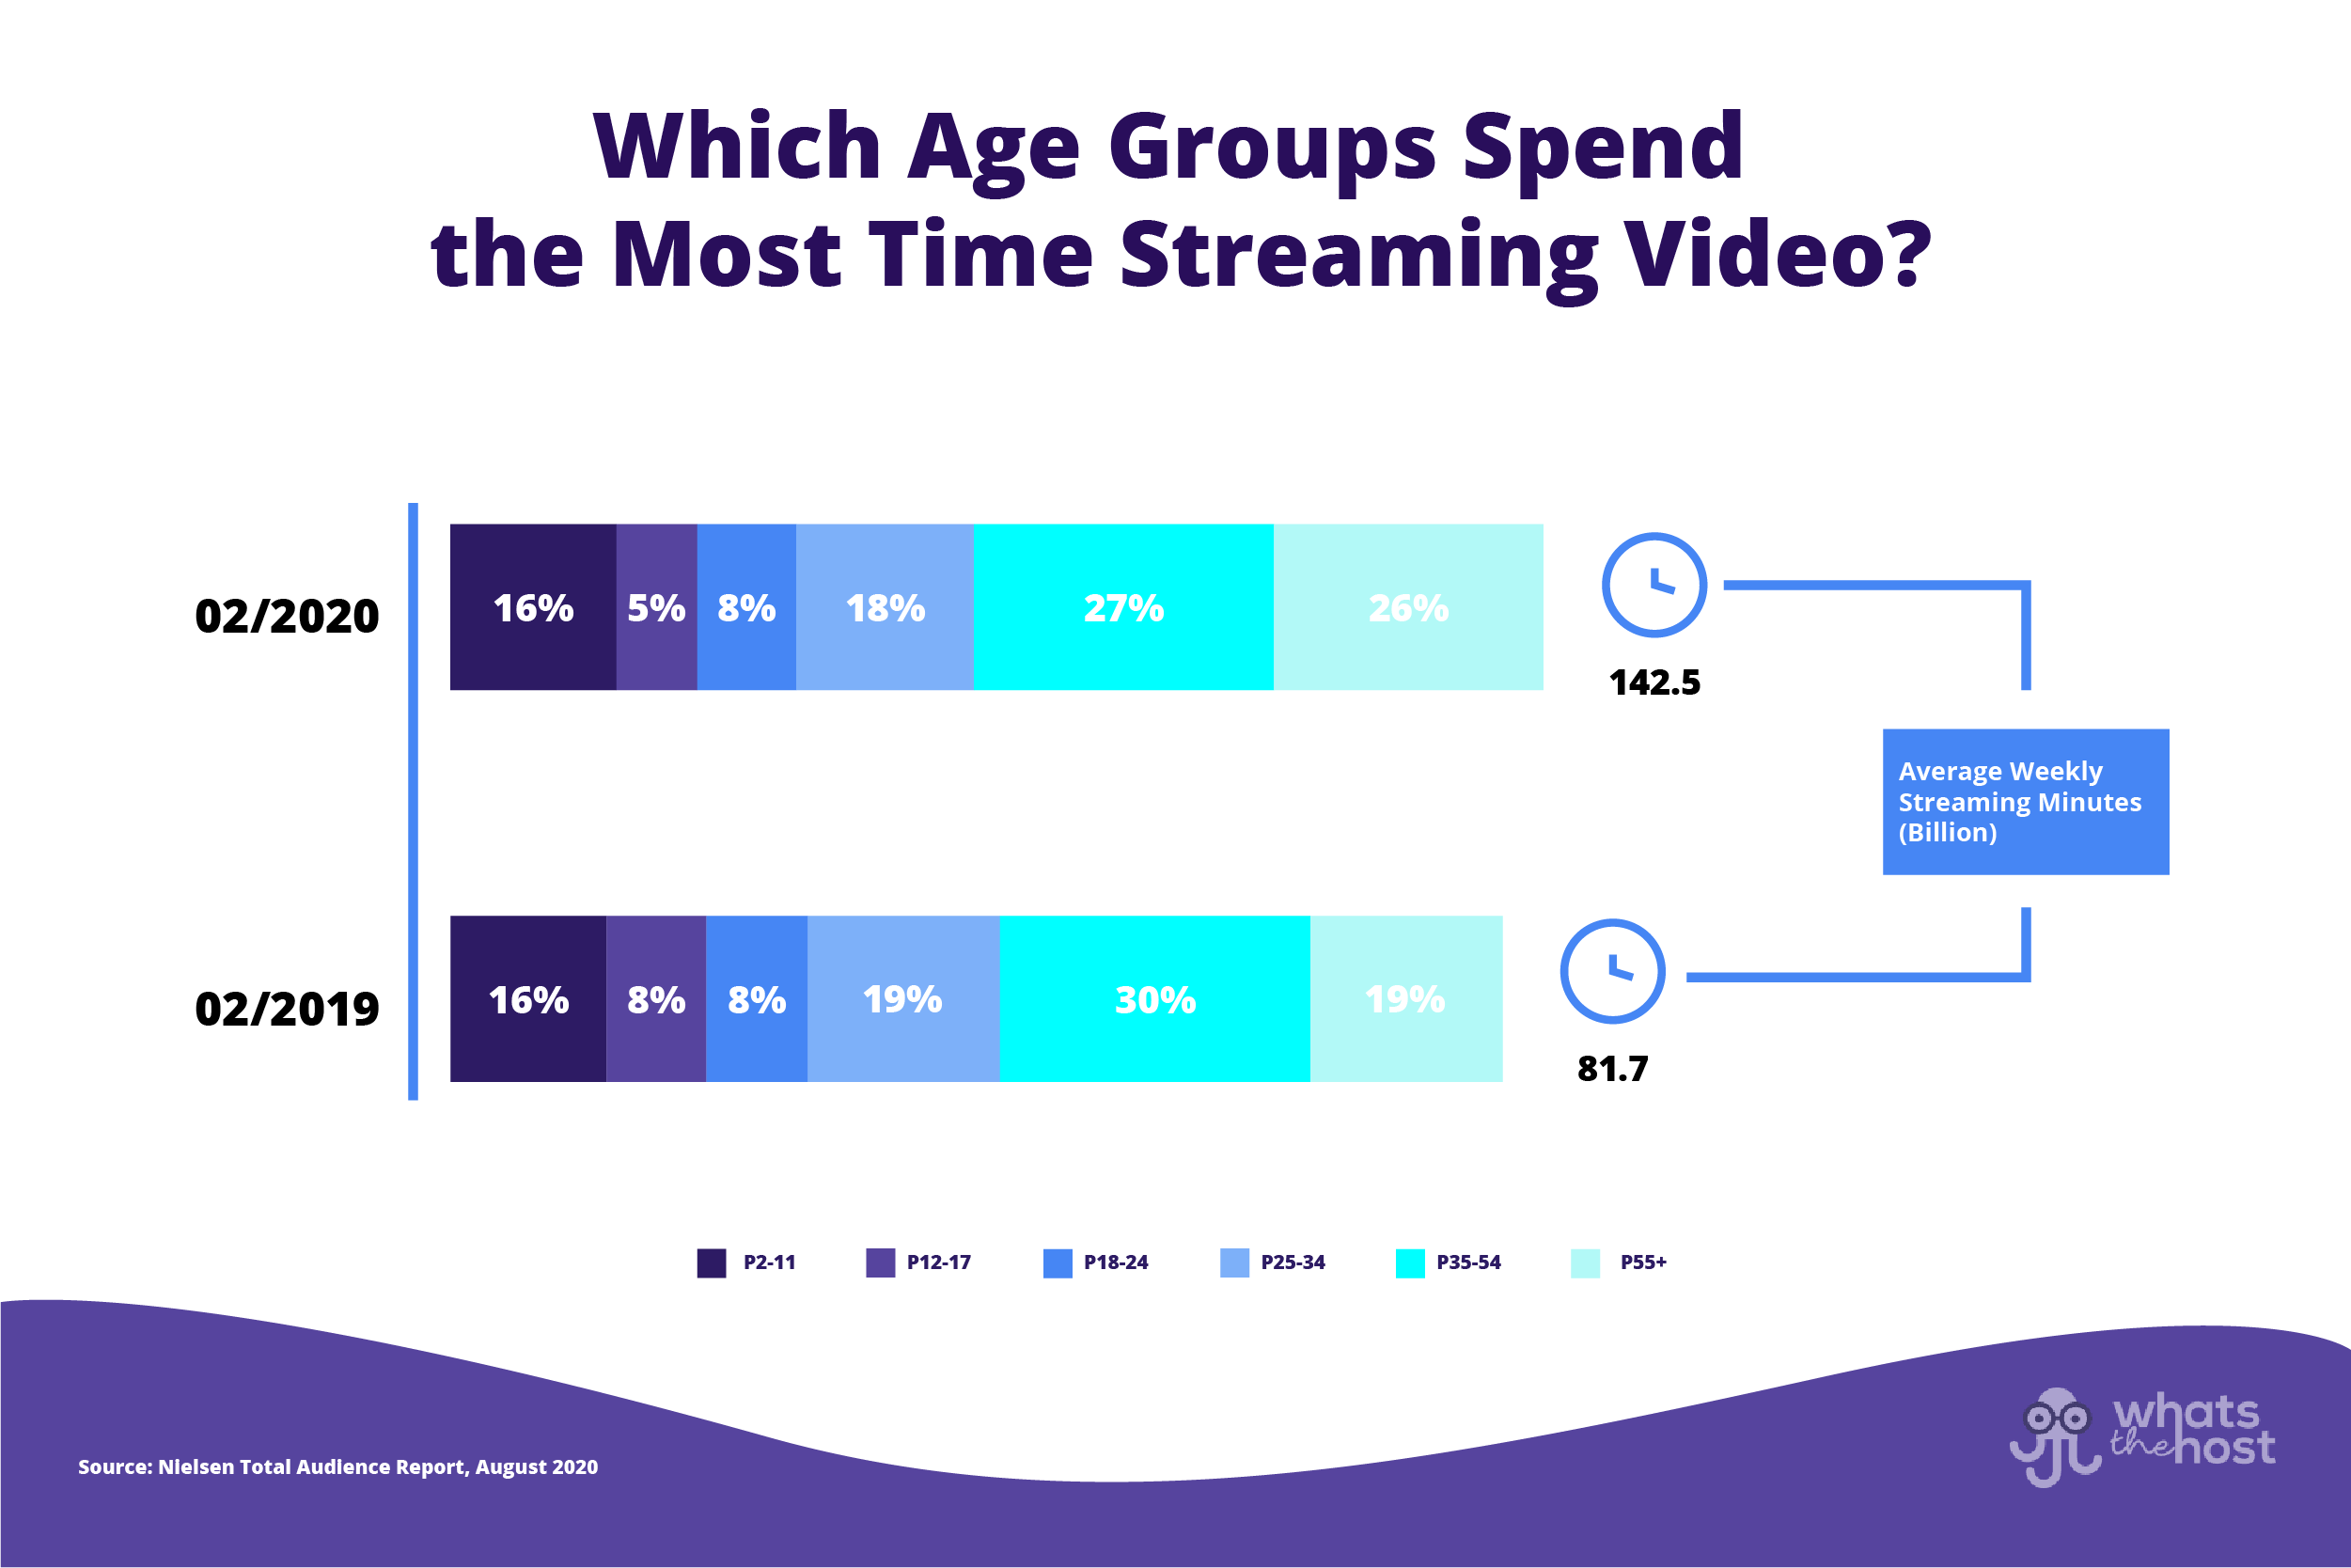
- U.S. consumers over the age of 55 were the demographic whose video streaming consumption increased the most during the pandemic. 26% of all streaming minutes in Q2 2020 were from this age group, up from just 19% the year before. [E]
- 25 percent of U.S. consumers reportedly increased their number of video streaming subscriptions during the pandemic. [E]
YouTube Video Streaming Statistics & Facts
YouTube at a glance
YouTube was founded in February 2005 by Chad Hurley, Steve Chen, and Jawed Karim. The site was bought by Google the following year in a $1.65 billion dollar acquisition, and now operates as a Google subsidiary. Susan Wojcicki is YouTube’s current CEO.
YouTube is available in more than 100 countries and 80 languages.
YouTube usage statistics
- Over 2 billion logged-in users visit YouTube each month. [M]
- 73% of U.S. adults use YouTube. [G]
- 51% of U.S. YouTube users say they visit the site daily.[H]
- YouTube has the highest adoption rate among U.S. users between the ages of 18 to 29, with 91% market penetration. [G]
- The higher your level of education, the more likely it is that you use YouTube. While YouTube is used by only 64% of U.S. consumers with a high school degree or less, it is used by 80% of college graduates. [G]
- Higher earning households use YouTube more than lower earning households. While 68% of U.S. consumers living in households making less than 30k per year use YouTube, 83% of consumers in 75k+ households use the platform. [H]
YouTube revenue statistics
- YouTube generated $7.85 billion in advertising revenue in the first half of 2020. This was an 18% increase over the previous year’s revenue. [I]
- Roughly 57% of YouTube’s advertising revenue is paid out to content creators. [J]
- YouTube’s largest U.S. advertiser in Q1 of 2020 was Apple with 2.31 billion impressions, followed by TurboTax (1.98 billion) and Expedia (1.97 billion). [K]
- In 2019, earnings from YouTube comprised approximately 9.4% of Google’s total revenue. [L]
- The number of YouTubers earning six figures annually on the platform grew more than 40% between 2019 and 2020. [M]
- The number of YouTubers earning five figures annually on the platform grew more than 50% between 2019 and 2020. [M]
YouTube content & channel statistics
- As of September 2020, there are over 44.7 million YouTube channels. [N]
- 500 hours of video are uploaded to YouTube every minute. [O]
- “Despacito” by Luis Fonsi is the most-viewed video on YouTube, with nearly 7 billion views as of September 2020.
- The number of YouTube channels with over 1 million subscribers grew 65% between 2019 and 2020. [M]
- YouTube productions won 4 Emmys in 2019. [P]
YouTube during COVID-19
- During the worldwide stay-at-home orders of spring 2020, YouTube accounted for nearly 16 percent of all traffic globally. This was nearly double their traffic share in 2019. [A]
- YouTube saw the greatest traffic growth in the Asia/Pacific region during the coronavirus lockdowns. YouTube’s traffic surpassed normal web browsing and torrenting to assume the top spot, accounting for more than 18 percent of APAC’s total web traffic in this time period, more than triple its 2019 numbers. [A]
- During the coronavirus lockdowns, YouTube accounted for 14.43% of all U.S.-based internet traffic, making it the second most trafficked application in the country. [A]
Netflix Statistics & Facts
Netflix at a glance
Netflix was founded in 1997 as an online DVD-rental company by co-CEOs Reed Hastings and Marc Randolph. In 2007, Netflix began to offer on-demand streaming media. In 2013, Netflix debuted its first exclusive series with House of Cards.
Today, Netflix streaming services are available in over 190 countries.
Netflix usage statistics
- As of April 2020, Netflix has 182.8 million subscribers worldwide. [Q]
- 70 million adults in the US & Canada have a Netflix subscription. [Q]
- Netflix is available in 86% of all North American homes that pay for any sort of TV service. [R]
- With shared accounts, it is estimated that Netflix reaches roughly 300 million people worldwide. [R]
Netflix revenue statistics
- In Q2 of 2020, Netflix reported $720 million in revenue, up from $270 million in Q2 of 2019. [S]
- As many as 15% of people watching Netflix at any given time are not subscribers – they are using the password from a friend or family member’s account. [T]
- The number of non-subscribers is higher among GenZ users – as many as 72% of GenZ Netflix users are not paying subscribers. [T]
Netflix content Statistics
- In 2019, Netflix launched an estimated 2,769 hours of original movies, TV shows and other productions, spending more than $15 billion dollars. [U]
- As of April 2020, Netflix offers 1,177 original movies and TV series with an average IMDb rating of 6.8 and an average Rotten Tomatoes score of 73%. [U]
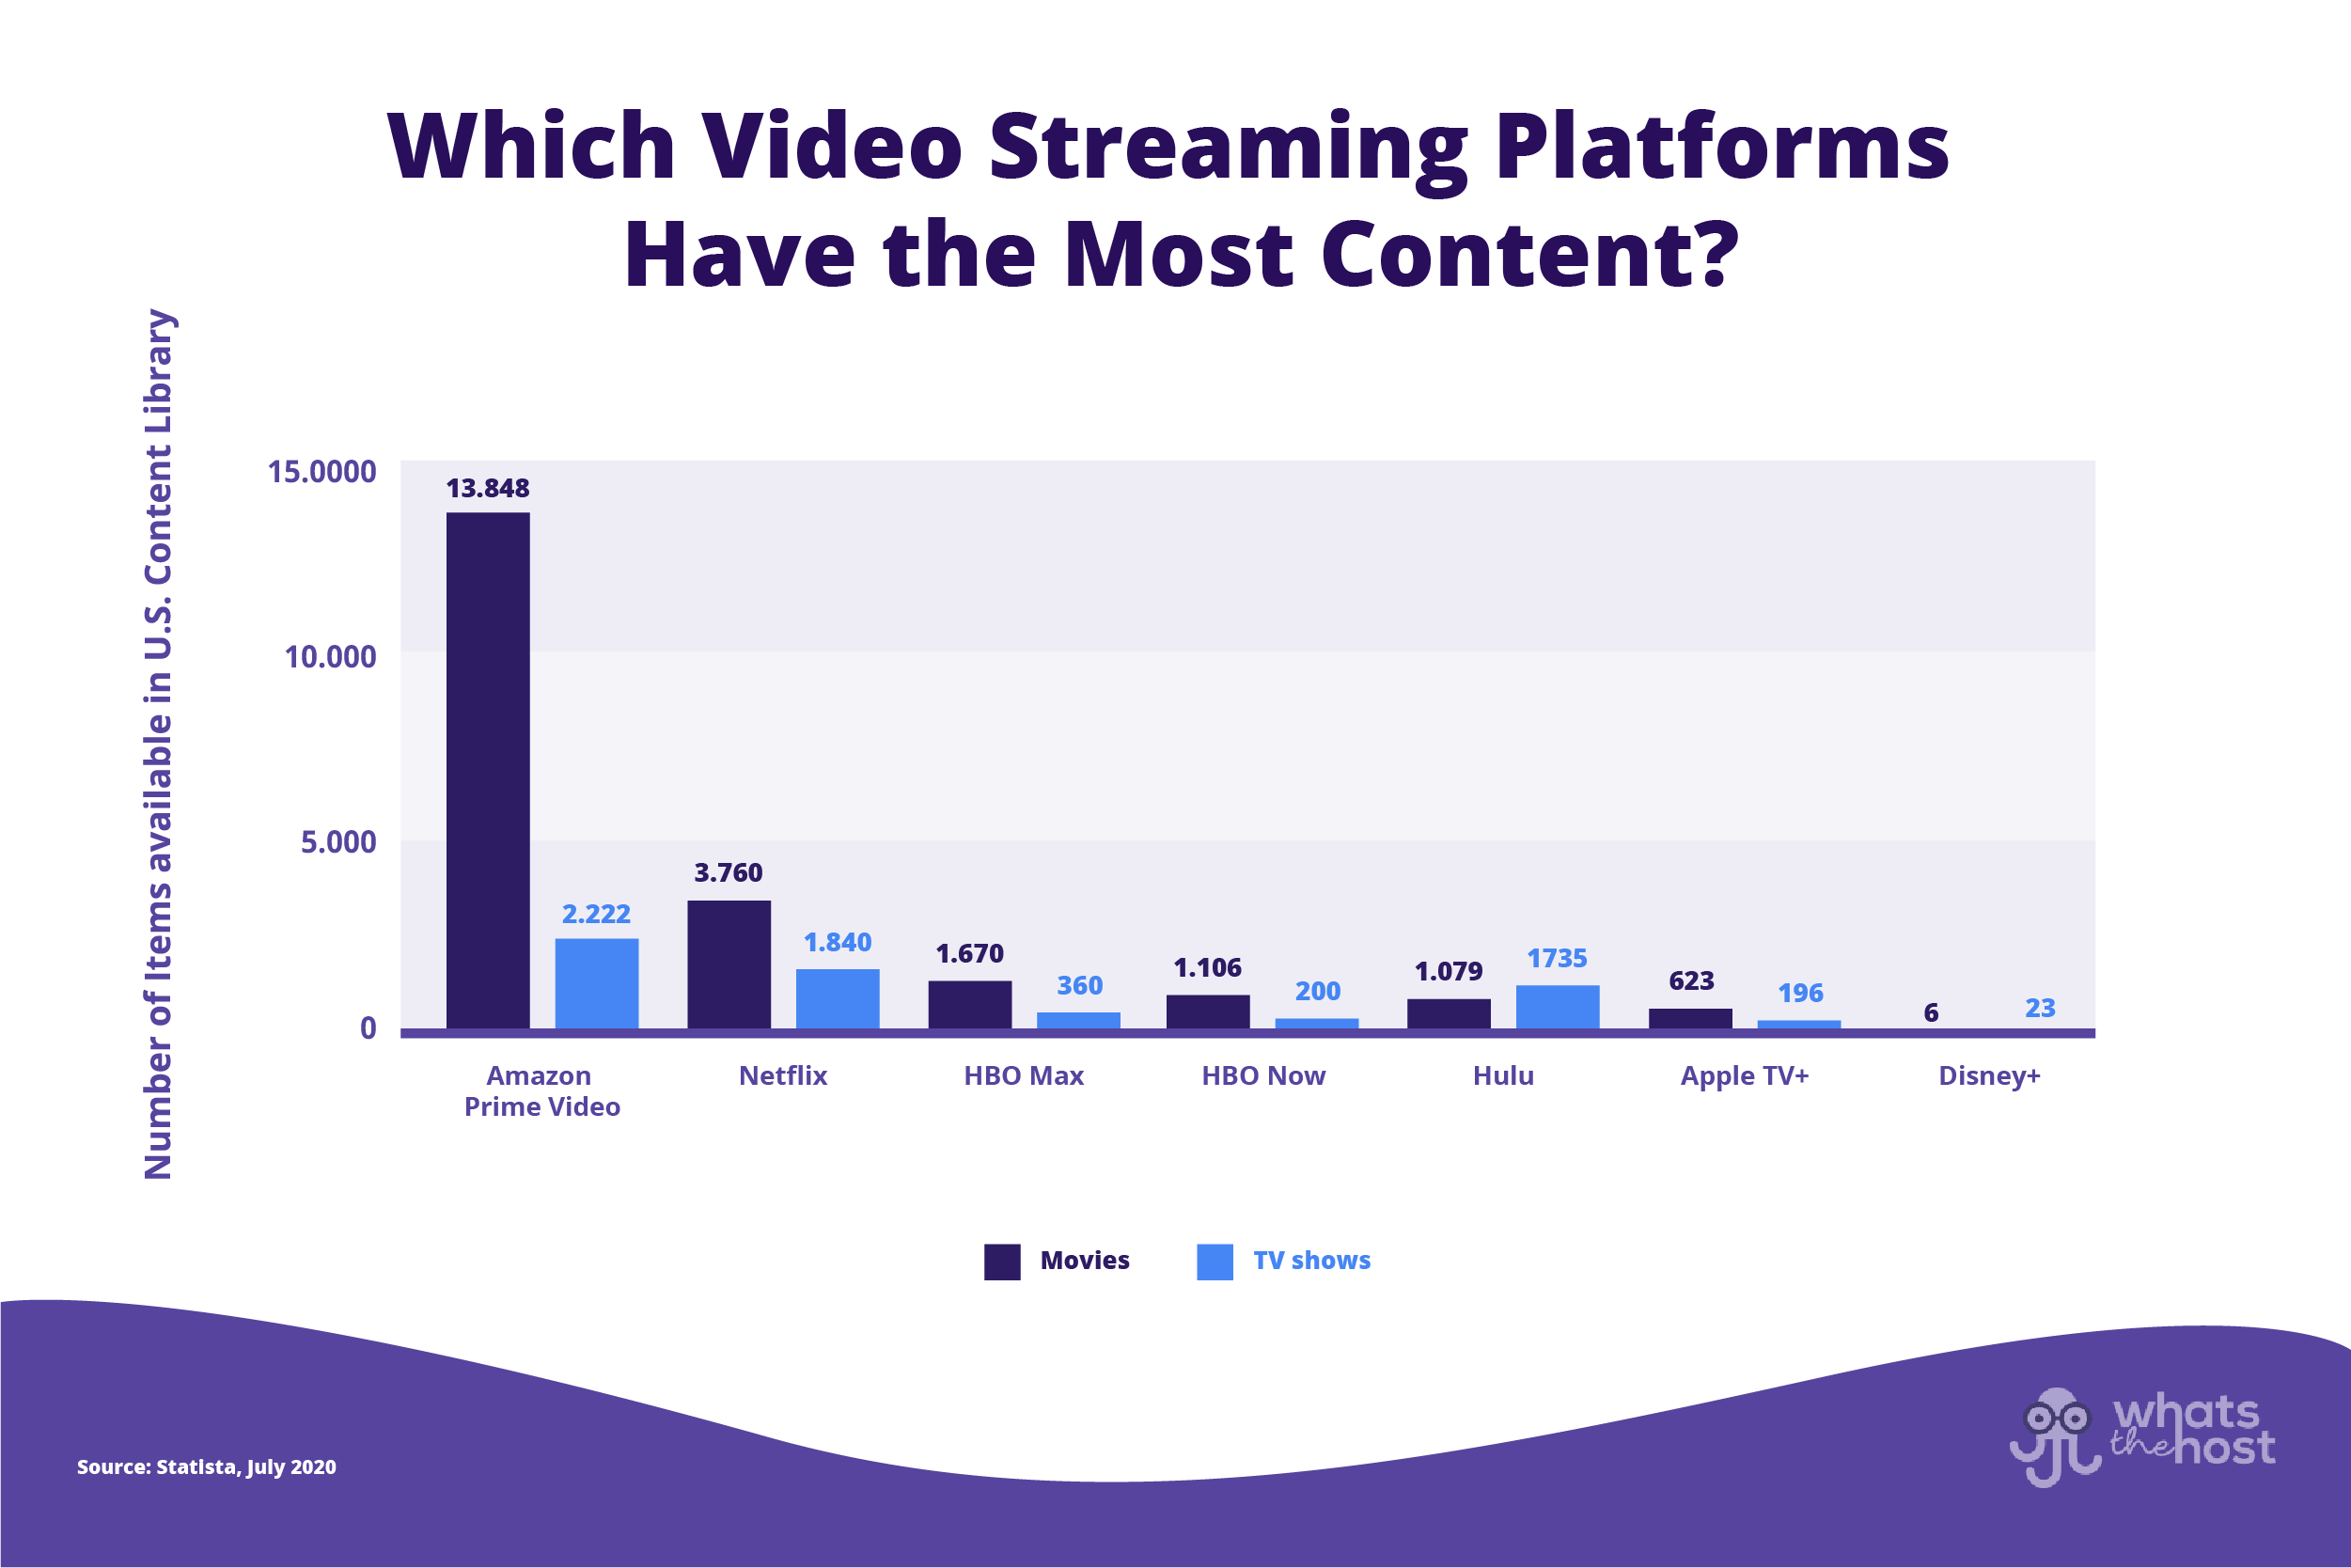
- Including licensed and original content, Netflix has a library of 3,760 movies and 1,840 TV series as of June 2020. [V]
- There are 726 original series offered across all subscription streaming video services. Netflix is the proprietor of 461 (63%) of them. [W]
- Netflix will spend an estimated $17 billion on licensing and creating content in 2020. 85% of this will go to creating Netflix originals. [X]
- Licensed shows are by far more popular than Netflix originals. In 2018, 72% of user time was spent watching licensed media instead of Netflix originals. [Y]
- From 2014 to 2020, Netflix originals have been nominated for 53 Oscars and won 8. [U]
- Netflix originals won 27 Emmys in 2019. [P]
Netflix during COVID-19
- During the spring of 2020, Netflix accounted for 11% of global internet traffic [A]
- During the coronavirus lockdowns, Netflix accounted for 19.11% of all U.S.-based internet traffic, making it the most trafficked application in the country. [A]
- During April of 2020, 50% of U.S. adults said they were using Netflix. [Z]
- Netflix saw unprecedented growth among the U.S. market in the spring of 2020. Netflix went from comprising 6% of U.S. internet traffic in 2019 to 19.11% of traffic during the coronavirus lockdowns. [A]
- Netflix added 2.3 million subscribers from the U.S. and Canada during the first quarter of 2020, and 13.5 million subscribers internationally. [Q]
- Because Netflix doesn’t run ads and doesn’t offer sports programming, it didn’t suffer from the major revenue blows dealt by the coronavirus pandemic that traditional TV channels did. [Q]
Hulu Statistics & Facts
Hulu at a glance
Hulu was founded in 2007 as a joint venture between News Corporation, NBC Universal, Providence Equity Partners, and the Walt Disney Company. In the beginning, Hulu showed recent episodes from these television networks. Starting in 2010, Hulu launched its subscription service featuring full seasons from these networks. In March of 2019, Disney acquired a 60% majority stake in Hulu. Kelly Campbell currently serves as Hulu’s president.
Hulu is available in the USA and Japan.
Hulu usage statistics
- As of the third quarter of 2020, Hulu has 35.5 million subscribers in the USA. [AA]
- The average Hulu subscription is shared by 2.9 viewers. [BB]
- 50% of Hulu users engage in binging – defined as watching three or more episodes in a single session. [BB]
Hulu content statistics
- Hulu has 73 original titles with an average IMDb rating of 7.2 and an average Rotten Tomatoes score of 77. [V]
- Counting both licensed and original content, Hulu has a library of 1,079 movies and 1,735 TV series. [V]
- Hulu plans to spend $3 billion on content in 2020. [X]
- Hulu originals won 4 Emmys in 2019. [P]
Hulu ads and revenue statistics
- Hulu generated $1.5 billion in ad revenue in 2018 and is projected to generate $2.7 billion in 2021. [CC]
- Hulu pulls in more revenue than the much larger Netflix because it runs ads. As of 2019, 70% of Hulu subscribers were on a plan that included advertisements. [BB]
- After finding that Hulu users pause videos 1 billion times per month, the service began running “pause ads.” [BB]
Hulu during COVID-19
- Hulu gained over 5 million subscribers in the USA from the start of the coronavirus pandemic in Q1 2020 to Q3. [AA]
- During April 2020, 30% of U.S. adults said they were using Hulu. [Z]
- Hulu accounted for 2.85% of all U.S. based internet traffic during the coronavirus lockdowns, making it the 7th most trafficked application. [A]
Amazon Prime Video Statistics & Facts
Amazon Prime Video at a glance
Prime Video was launched in 2006 as “Amazon Unbox,” eventually merging with the Amazon Prime membership. The service began to expand into Europe in 2014, and by 2016 it was launched worldwide with the only exceptions being Mainland China, Cuba, Iran, North Korea, and Syria.
Prime Video comes with the general Amazon Prime subscription, which distinguishes the service from the likes of Netflix and Hulu.
Prime Video is currently lead by former Sony executive Mike Hopkins.
Prime Video usage statistics
- Amazon Prime Video has over 150 million subscribers globally, up from 100 million just one year prior. [EE]
- Younger demographics are the most frequent viewers of Prime Video content. 23% of SVoD U.S. users aged 18-29 said they viewed Prime Video content at least once per day. [DD]
- Movies are the most popular type of content watched on Prime Video, with two thirds of U.S. consumers using it to watch recently released movies in 2017. [DD]
Prime Video content statistics
- Amazon Prime has 222 original titles with an average IMDb rating of 7.2 and an average Rotten Tomatoes score of 76%. [U]
- From 2014-2020, Prime originals have been nominated for 11 Oscars and won 3. [U]
- Counting both licensed and original content, Amazon Prime Video has a library of 13,848 movies and 2,222 TV series. [V]
- Prime Video plans to spend $7 billion on content in 2020. [EE]
- Amazon Prime Video originals won 15 Emmys in 2019. [P]
Prime Video revenue and ads statistics
- Amazon generated $700 million in global ad revenue from Prime in 2017. This is projected to grow to $2.5 billion by the end of 2020. [FF]
- Amazon offers users the chance to subscribe to specific channels, like HBO and Showtime, keeping an average of 30% of the subscription fees for themselves. [FF]
Prime Video during COVID-19
- During April 2020, 42% of U.S. adults said they were using Amazon Prime Video. [Z]
- Amazon Prime Video accounted for 2.89% of all U.S.-based internet traffic during the coronavirus lockdowns, making it the 6th most trafficked application. [A]
Sources
[A] Sandvine (2020, May). “The Global Internet Phenomena Report: COVID-19 Spotlight” https://www.sandvine.com/covid-internet-spotlight-report
[B] Grand View Research (2020, June). “Video Streaming Market Worth $184.2 Billion By 2027 | CAGR 20.4%.” https://www.grandviewresearch.com/press-release/global-video-streaming-market
[C] Fierce Video (2018, Nov.). “Video will account for 82% of all internet traffic by 2022, Cisco says.” https://www.fiercevideo.com/video/video-will-account-for-82-all-internet-traffic-by-2022-cisco-says
[D] CNN Business (2020, March). “Netflix and YouTube are slowing down in Europe to keep the internet from breaking.” https://edition.cnn.com/2020/03/19/tech/netflix-internet-overload-eu/index.html
[E] Nielson (2020, Aug.). “The Nielson Total Audience Report: August 2020.” https://www.nielsen.com/us/en/insights/report/2020/the-nielsen-total-audience-report-august-2020/
[F] Variety (2020, May). “Study Shows 70% of Consumers Would Rather Watch New Movies at Home.” https://variety.com/2020/film/news/new-movies-better-at-home-than-in-theaters-performance-research-1234611208/
[G] Pew Research (2019, June). “Who uses YouTube, WhatsApp and Reddit.” https://www.pewresearch.org/internet/chart/who-uses-youtube-whatsapp-and-reddit/
[H] Pew Research. (2019, April). “Share of U.S. adults using social media, including Facebook, is mostly unchanged since 2018.” https://www.pewresearch.org/fact-tank/2019/04/10/share-of-u-s-adults-using-social-media-including-facebook-is-mostly-unchanged-since-2018/
[I] Statista (2020, July). “Worldwide advertising revenues of YouTube as of 1st quarter 2020.” https://www.statista.com/statistics/289657/youtube-global-quarterly-advertising-revenues/
[J] The Verge (2020, Feb). “Creators finally know how much money YouTube makes, and they want more of it.” https://www.theverge.com/2020/2/4/21121370/youtube-advertising-revenue-creators-demonetization-earnings-google
[K] Statista (2020, April). “Leading YouTube advertisers in the United States in 1st quarter 2020 by number of impressions.” https://www.statista.com/statistics/1094368/us-youtube-advertisers-ranked-by-impressions/
[L] Statista (2020, April). “YouTube – Statistics & Facts.” https://www.statista.com/topics/2019/youtube/
[M] YouTube (visited 2020, September). “YouTube for Press.” https://www.youtube.com/about/press/
[N] SocialBlade (visited 2020, September). https://www.socialblade.com
[O] Statista (2019, May). “Hours of video uploaded to YouTube every minute.” https://www.statista.com/statistics/259477/hours-of-video-uploaded-to-youtube-every-minute/
[P] Deadline (2019, Sept.) “HBO Tops Netflix with most Total Emmy Wins, but Amazon finishes Strong.” https://deadline.com/2019/09/hbo-holds-off-netflix-to-capture-most-total-emmy-wins-1202740832/
[Q] New York Times (2020, April). “Everyone You Know Just Signed Up for Netflix.” https://www.nytimes.com/2020/04/21/business/media/netflix-q1-2020-earnings-nflx.html
[R] Deadline (2019, Dec.) “Netflix is Available in More Than 300M Global Pay-TV Households, report estimates.” https://deadline.com/2019/12/netflix-is-available-in-more-than-300m-global-pay-tv-households-report-estimates-1202798394/
[S] Statista (2020, July). “Net income generated by Netflix from 1st quarter 2011 to 2nd quarter 2020.” https://www.statista.com/statistics/273884/netflixs-quarterly-net-income/
[T] Film Daily (2020, May). “Netflix is calling an end to password sharing: What you can do.” https://filmdaily.co/news/netflix-password-sharing/
[U] AllConnect (2020, April). “Which streaming service has the best original shows and movies?” We scraped the data to find out.” https://www.allconnect.com/blog/ranking-best-original-content-streaming
[V] Statista (2020, June). “Content available on major SVoD platforms in the United States in June 2020, by type.” https://www.statista.com/statistics/1110424/svod-content-catalog-size-by-type-us/
[W] PC Mag (2020, July). “Netflix has the Most Original TV Shows, by Disney+ Shows the Best Originals.” https://uk.pcmag.com/why-axis/127855/netflix-has-the-most-original-tv-shows-but-disney-shows-the-best-originals
[X] Deadline (2020, Jan.) “Netflix Spending on Content set to Climb past $17B in 2020.” https://deadline.com/2020/01/netflix-spending-on-content-set-to-climb-past-17b-in-2020-analyst-expects-1202832546/
[Y] Wall Street Journal (2019, April). “Netflix Fights to Keep Its Most Watched Shows: ‘Friends’ and ‘The Office.’” https://www.wsj.com/articles/netflix-battles-rivals-for-its-most-watched-shows-friends-and-the-office-11556120136
[Z] Business Wire (2020, June). “Strategy Analytics: Netflix, Hulu User Numbers Declined as COVID-19 stay-at-home measures were relaxed.” https://www.businesswire.com/news/home/20200625005681/en/Strategy-Analytics-Netflix-Hulu-User-Numbers-Declined
[AA] Statista (2020, Aug.). “Number of Hulu's paying subscribers in the U.S. 2010-2020, by quarter.” https://www.statista.com/statistics/258014/number-of-hulus-paying-subscribers/
[BB] Variety (2019, May). “Hulu says 70% of its 82 million viewers are on ad-supported plan.” https://variety.com/2019/digital/news/hulu-ad-supported-subscribers-70-percent-1203227954/
[CC] Fierce Video (2019, March). “Hulu’s ad revenues will reach $2.7B by 2021, eMarketer says.” https://www.fiercevideo.com/video/hulu-s-ad-revenues-will-reach-2-7b-by-2021-emarketer-says
[DD] Statista (2019, Jan). “Amazon Prime Video – Statistics & Facts.” https://www.statista.com/topics/4740/amazon-prime-video/
[EE] Forbes (2020, May). “Streaming Wars Continue: Here’s how much Netflix, Amazon, Disney+ and their rivals are spending on new content.” https://www.forbes.com/sites/sergeiklebnikov/2020/05/22/streaming-wars-continue-heres-how-much-netflix-amazon-disney-and-their-rivals-are-spending-on-new-content/
[FF] Variety (2018, Dec.). “Amazon’s Prime Video Channels Biz to Generate $1.7 Billion in 2018.” https://variety.com/2018/digital/news/amazon-prime-video-channels-tv-revenue-estimates-1203083998/
Last Updated on February 23, 2023 by Joe