
Black Friday, the traditional start of the holiday shopping season, falls on Nov. 29 this year. The sales extravaganza is often the busiest shopping day on the calendar, and it provides the economic backbone for many retailers.
We've collected some of the most fascinated statistics that explain Black Friday and Cyber Monday 2019.
The History of Black Friday
The term “Black Friday” was originally used to describe a very dark financial day: the American gold market crash of September 1869. However, it is now used to mark the frenetic shopping bonanza that takes place on the day after Thanksgiving each year.
Retailers have looked forward to the day since President Abraham Lincoln first designated Thanksgiving a national holiday back in 1863, and it slowly increased in importance as the years passed. In 1924, Macy's kicked off its renowned Thanksgiving Day parade in New York City after seeing the success of Canadian department store Eaton's Santa-themed parade in Toronto, which began in 1905. The excitement surrounding the parade boosted sales the day after Thanksgiving, and the event soon became a cultural touchstone.
It is an oft-repeated myth that Black Friday got its name because retailers operated “in the red” all year, and the day after Thanksgiving finally brought them “into the black.” However, the real story behind the name dates back to 1950s Philadelphia. Every year, throngs of shoppers came to the city in anticipation of the classic Army-Navy football game. City police officers called it Black Friday because they were forced to work extra shifts all weekend to control crowds and thwart shoplifters.
While the term caught on and became part of advertising campaigns for Philly stores, it didn't spread to other states until the late 1980s. When it did, it was pushed as a positive, exciting event for both retailers and shoppers. By 2005, Cyber Monday, the Monday after Thanksgiving, was adopted by online retailers to bookend the holiday weekend and rake in even more sales. The sales frenzy also bled into Thanksgiving itself, with shoppers encouraged to begin their holiday shopping right after downing their turkey dinner.
Here are 25 Black Friday and Cyber Monday statistics to keep in mind as you shop this year.
Black Friday Weekend Sales Trends
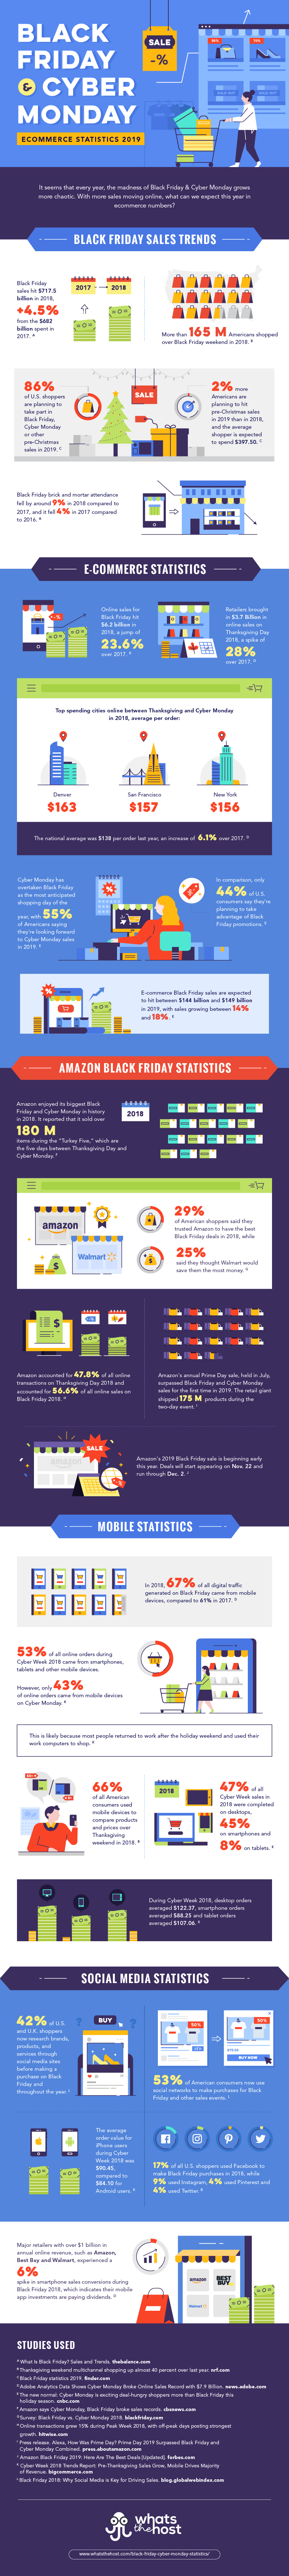
Black Friday sales hit $717.5 billion in 2018, up 4.3% from the $682 billion spent in 2017. (TheBalance.com, 2019)
More than 165 million Americans shopped over Black Friday weekend in 2018. (National Retail Federation, 2018)
86% of U.S. shoppers are planning to take part in Black Friday, Cyber Monday or other pre-Christmas sales in 2019. (Finder.com, 2019)
12% more Americans are planning to hit pre-Christmas sales in 2019 than in 2018, and the average shopper is expected to spend $397.50. (Finder.com, 2019)
While Black Friday is still the busiest shopping day of the year for brick and mortar stores, foot traffic is decreasing. Attendance fell by around 9% in 2018 compared to 2017, and it fell 4% in 2017 compared to 2016. (RetailNext via TheBalance.com, 2019)
Black Friday & Cyber Week E-Commerce Statistics
Online sales for Black Friday hit $6.2 billion in 2018, a jump of 23.6% over 2017. (Adobe Analytics, 2018)
Retailers brought in $3.7 billion in online sales on Thanksgiving Day 2018, a spike of 28% over 2017. (Adobe Analytics, 2018)
According to e-commerce statistics, Denver residents spent the most money online between Thanksgiving and Cyber Monday in 2018, spending an average of $163 per order. San Francisco residents were second, with an average of $157 per order, and New York residents came in third, with an average of $156 per order. The national average was $138 per order last year, an increase of 6.1% over 2017. (Adobe Analytics, 2018)
Cyber Monday statistics show that the annual online sales frenzy has overtaken Black Friday as the most anticipated shopping day of the year, with 55% of Americans saying they're looking forward to Cyber Monday sales in 2019. In comparison, only 44% of U.S. consumers say they're planning to take advantage of Black Friday promotions. (Deloitte via CNBC.com, 2019)
E-commerce Black Friday sales are expected to hit between $144 billion and $149 billion in 2019, with sales growing between 14% and 18%. (Deloitte via CNBC.com, 2019)
Amazon Black Friday & Cyber Week Statistics
Amazon enjoyed its biggest Black Friday and Cyber Monday in history in 2018. While the retailer did not provide sales figures, it reported that it sold over 180 million items during the “Turkey Five,” which are the five days between Thanksgiving Day and Cyber Monday. (Amazon via CBSNews.com, 2018)
29% of American shoppers said they trusted Amazon to have the best Black Friday deals in 2018, while 25% said they thought Walmart would save them the most money. (Blackfriday.com, 2018)
Amazon accounted for 47.8% of all online transactions on Thanksgiving Day 2018 and accounted for 56.6% of all online sales on Black Friday 2018. (Hitwise.com, 2018)
Amazon's annual Prime Day sale, held in July, surpassed Black Friday and Cyber Monday sales for the first time in 2019. The retail giant shipped 175 million products during the two-day event. (Amazon, 2019)
Amazon's 2019 Black Friday sale is beginning early this year. Deals will start appearing on Nov. 22 and run through Dec. 2. (Amazon via Forbes.com, 2019)
Black Friday & Cyber Week Mobile Statistics
In 2018, 67% of all digital traffic generated on Black Friday came from mobile devices, compared to 61% in 2017. (Adobe Analyitcs, 2019)
53% of all online orders during Cyber Week 2018 came from smartphones, tablets and other mobile devices. However, only 43% of online orders came from mobile devices on Cyber Monday. This is likely because most people returned to work after the holiday weekend and used their work computers to shop. (BigCommerce.com, 2018)
66% of all American consumers used mobile devices to compare products and prices over Thanksgiving weekend in 2018. (National Retail Federation)
47% of all Cyber Week sales in 2018 were completed on desktops, 45% on smartphones and 8% on tablets. (BigCommerce.com, 2019)
During Cyber Week 2018, desktop orders averaged $122.37, smartphones orders averaged $88.25 and tablet orders averaged $107.06. (BigCommerce.com, 2019)
Black Friday & Cyber Week Social Media Statistics
42% of U.S. and U.K. shoppers now research brands, products and services through social media sites before making a purchase on Black Friday and throughout the year. (GlobalWebIndex.com, 2018)
53% of American consumers now use social networks to make purchases for Black Friday and other sales events. (GlobalWebIndex.com, 2018)
The average order value for iPhone users during Cyber Week 2018 was $90.45, compared to $84.10 for Android users. (BigCommerce.com, 2018)
17% of all U.S. shoppers used Facebook to make Black Friday purchases in 2018, while 9% used Instagram, 4% used Pinterest and 4% used Twitter. National Retail Federation, 2018)
Major retailers with over $1 billion in annual online revenue, such as Amazon, Best Buy and Walmart, experienced a 6% spike in smartphone sales conversions during Black Friday 2018, which indicates their mobile app investments are paying dividends. (Adobe Analytics, 2018)
Last Updated on October 21, 2020 by Joe